How to Measure Elementor Image Improvements: Free, Then Pro
Both · Practical Elementor tutorial
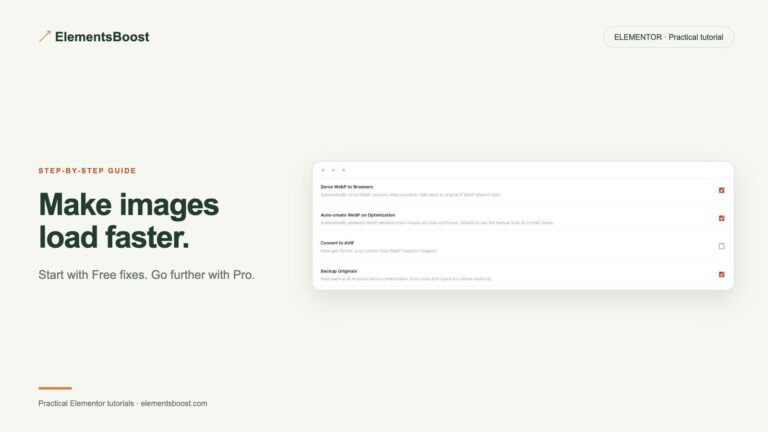
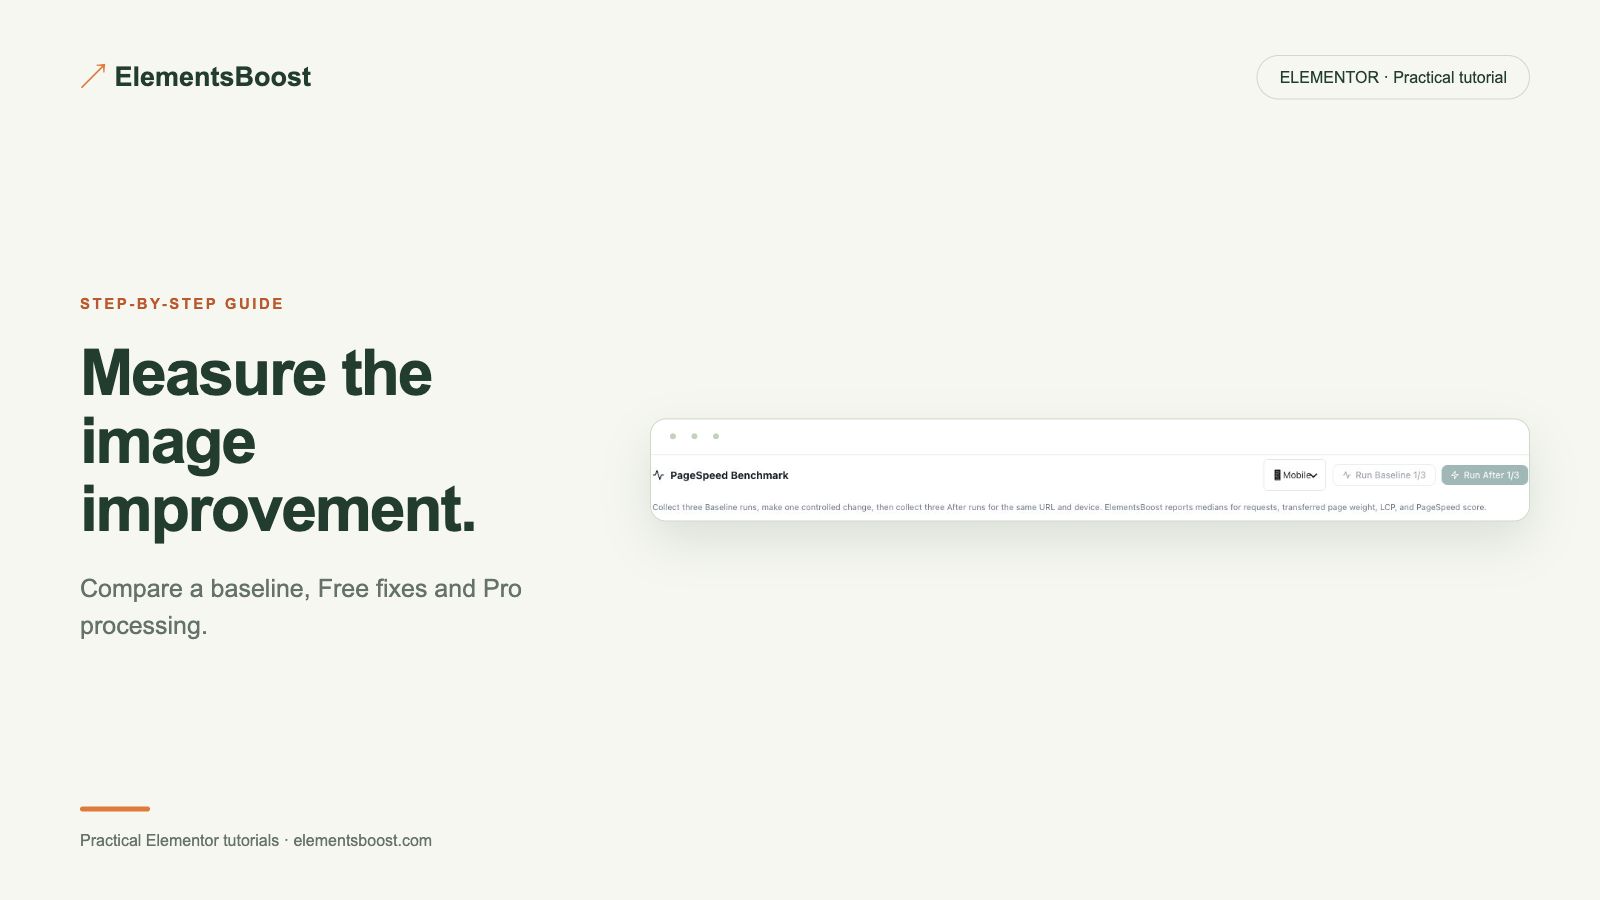
Use this repeatable workflow to measure the same page before changes, after Free fixes, and after a selected Pro improvement. You will build your own comparison with recorded file sizes and matched tests. The screenshots below show controls, not a claimed performance gain.
What you will achieve
See what each tier changed on one reproducible page.
Free: Run diagnosis, apply eligible Free fixes and record that intermediate result.
Pro: Then apply selected local image/per-page tools and measure their incremental effect.
1. Define one reproducible page
Choose a public test page you control with representative local images and stable content. Record its URL, viewport, plugin versions, hosting/cache conditions and image sources. Keep the design—including purposeful animations—the same across stages. A local-only site cannot supply a public PageSpeed comparison.
2. Capture the untouched baseline
Run three comparable mobile tests and retain each result, then calculate the median for the reported metrics. Save a full-page screenshot and the relevant image requests. Record bytes and dimensions for the exact resources that later changes will target.

3. Apply and measure Free-only fixes
Use Free diagnosis and eligible actions such as dimension correction or appropriate below-fold loading. Label any manual Elementor source-size change separately. Record every change, clear the relevant cache under the documented conditions and repeat the three matched tests. This intermediate result is essential to show Free’s contribution.
4. Apply and measure the Pro step
Add only the justified Pro action, such as backed-up local compression or supported format delivery. Verify appearance and the served resource before repeating the same measurements. Keep the Free-stage configuration intact so the incremental effect can be distinguished.
5. Report the complete evidence
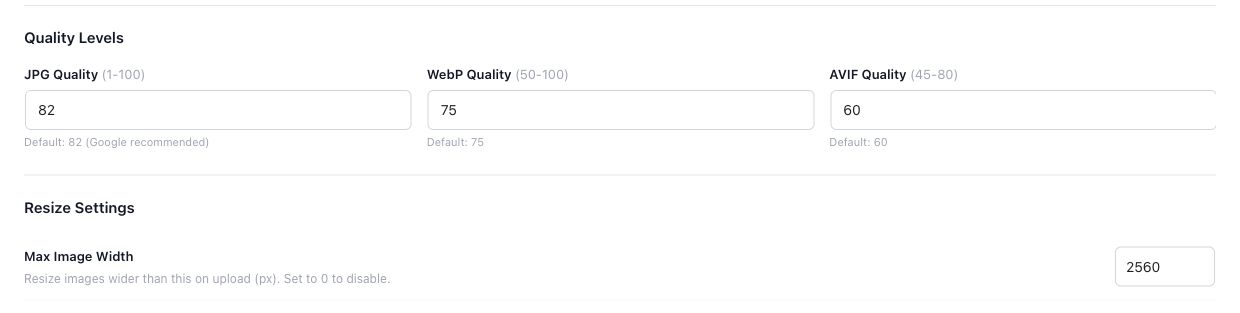
Present baseline, Free and Free-plus-Pro values with units and the three individual runs. Explain any unchanged or worse metric rather than hiding it. Include actual settings, before/after resources and the same viewport screenshots. If you share the comparison, describe only the results you actually recorded.
If the result is different
If the Pro step does not improve the chosen metric, report that result and investigate the remaining bottleneck. Keep all three stages distinct; an unrelated test or a two-stage comparison cannot establish Free’s and Pro’s separate contributions.
For supported frontend changes, follow the testing and recovery guide. Persistent content and image changes need their own backups; private Test Mode output cannot be measured by a public scanner.
Choose the next step that fits your page
Compare the Free result first, then measure whether a specific Pro feature adds value on your page.
When Pro is the useful next step
Pro is worth considering when a measured image-processing step improves your page beyond the Free result. Compare the served files and appearance, not just a score.
See Pro plans and included features →
Choose the license for the number of sites you manage. Check the feature comparison and license terms before buying.