How to Track Elementor PageSpeed Changes After an Update
Pro-first · Practical Elementor tutorial
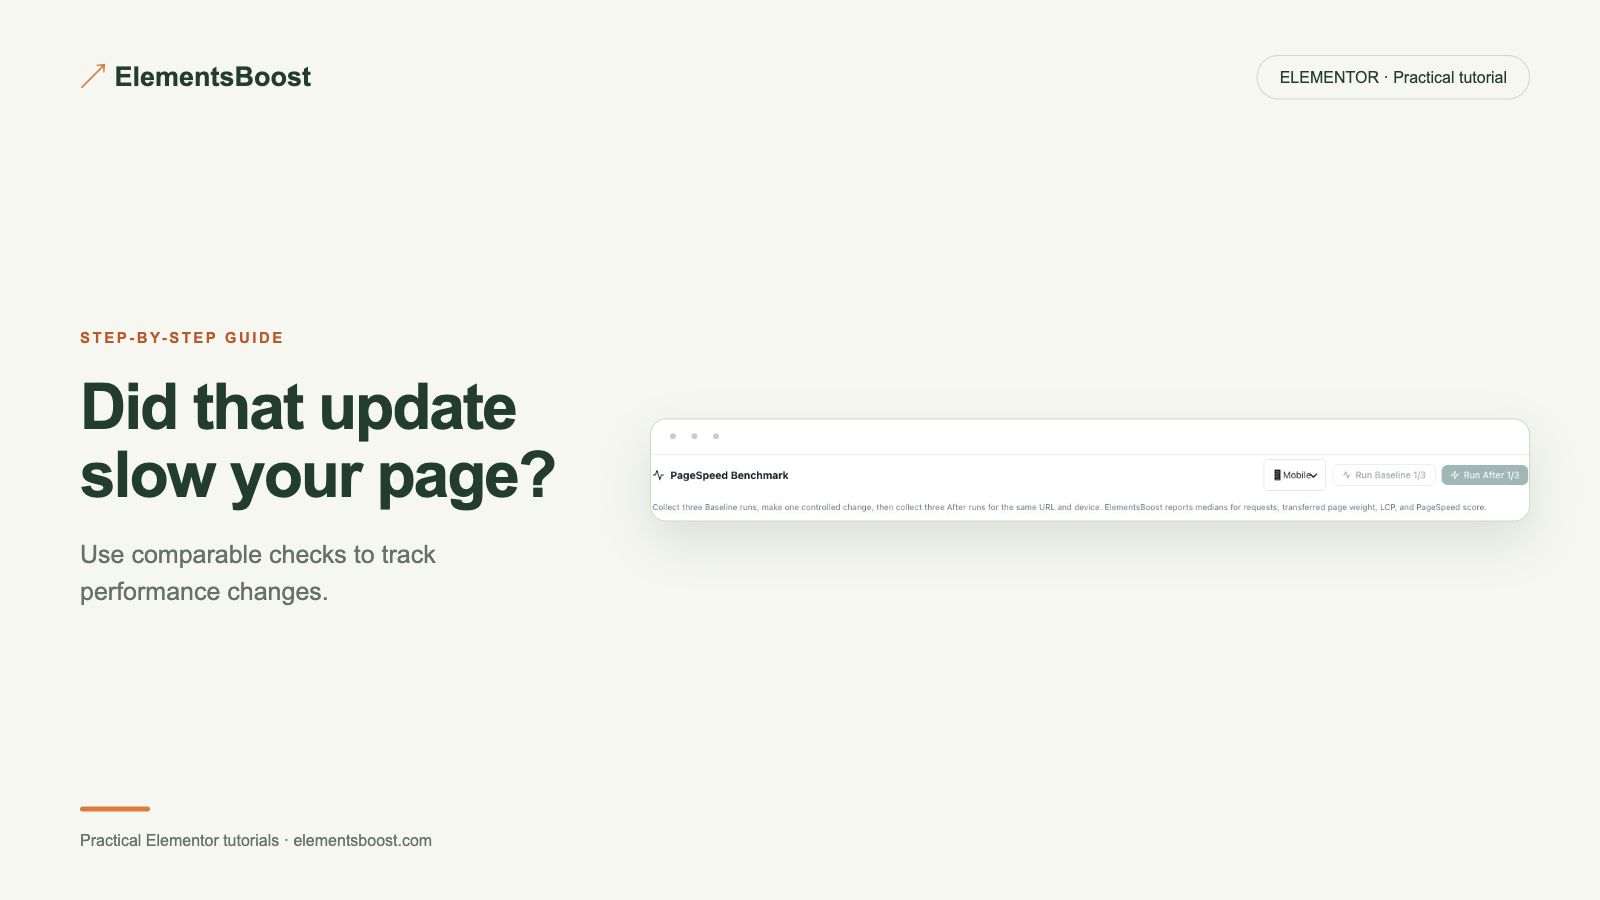
A single performance test is easy to lose. A saved baseline makes it possible to ask what changed after a plugin update, image replacement or layout edit. Free already provides on-demand Lighthouse testing; Pro is useful when you need history, comparisons and supported scheduled monitoring.
What you will achieve
Keep a baseline and spot a later regression instead of losing the previous result.
Free: On-demand Lighthouse tests are already available in Free.
Pro: Saved history, comparisons and scheduled monitoring using the site owner’s API key.
1. Choose a representative public page
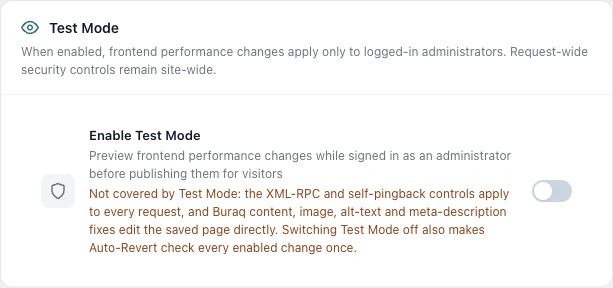
Use a stable URL that a public performance service can reach. Record mobile or desktop mode and the page state. A local-only URL or private Test Mode output cannot be measured by a public scanner. Keep the important page content consistent during the comparison.
2. Save a baseline
Run comparable tests and save the supported Pro baseline/history entry. Where the workflow provides three matched runs, compare their median rather than selecting the best score. Record the date, plugin versions and current optimization settings alongside the result.

3. Configure monitoring carefully
Open the supported monitoring controls and supply the site owner’s PageSpeed API key through the private settings field. Never include the key in screenshots or article text. Choose the available schedule that fits the need and verify the setup reports success; an entered key alone does not prove scheduled tests run.
4. Inspect a subsequent real result
After an actual update or the next scheduled run, open the saved comparison. Check LCP, layout shift and blocking work alongside the overall score. Small lab variations are normal; compare repeated results before attributing a difference to one setting.
5. Investigate the changed resource
Use Free page findings and browser evidence to locate a new heavy image, stylesheet or script. Keep the update and the performance test close enough in time to make the comparison meaningful. Retest after a focused correction and preserve both records.
If the result is different
If history is missing, verify the public URL, API response and supported scheduler status. Do not confuse a fresh one-off result with a working recurring monitor. Keep a real baseline and compare it with a subsequent run before concluding that performance changed.
For supported frontend changes, follow the testing and recovery guide. Persistent content and image changes need their own backups; private Test Mode output cannot be measured by a public scanner.
Choose the next step that fits your page
Keep on-demand testing in Free, or use Pro when you need saved history and ongoing comparisons.
When Pro is the useful next step
Pro adds PageSpeed history and monitoring for ongoing comparisons. Monitoring requires your own API key; consistent test conditions still matter.
See Pro plans and included features →
Choose the license for the number of sites you manage. Check the feature comparison and license terms before buying.